Report on Environmental conservation
(Information on sites in Japan)
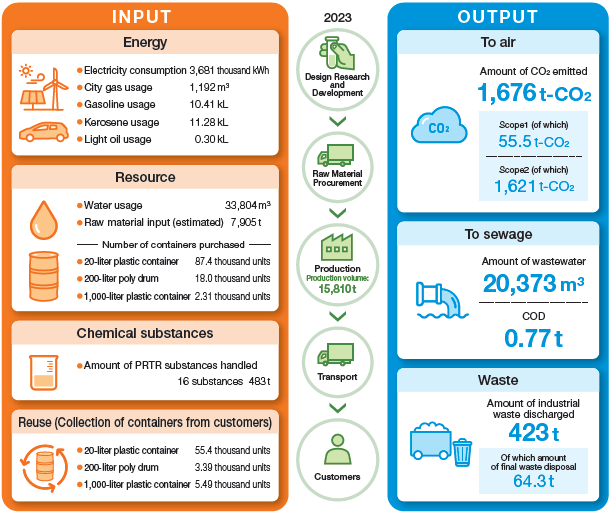
Relationship between business activities and the environment
The Company develops, manufactures, and sells chemicals, equipment and related materials used in the production of PCB. In conducting business activities, we consume energy and use resources. Recognizing this, we are working to reduce our environmental burden. In addition to complying with environmental laws and regulations, etc., related to business activities, we provide products that take into consideration energy conservation measures, waste reduction, proper management of chemical substances, and product life cycle. The aim is to make effective use of resources, prevent pollution, and conserve the environment.
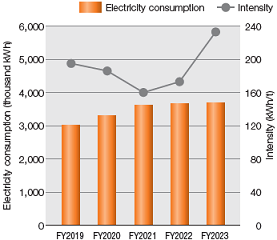
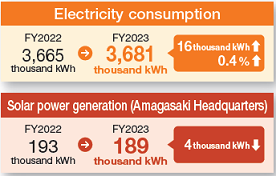
Electricity consumption
Electricity consumption in FY2024 increased from FY2023. Since the manufacturing volume increased more than the electricity consumption did, the intensity has decreased. Electricity use is expected to continue to increase as it is mainly used to improve the working environment. In order to reduce our environmental impact as much as possible, we are generating electricity with solar power on the roof of the Amagasaki Headquarters.
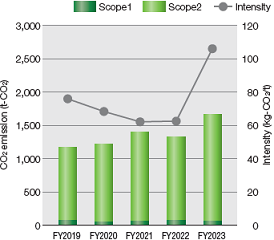
CO2 emission
We have calculated the GHG protocol Scope 1 (fuel) and Scope 2 (electricity and heat) as CO2 emissions. Scope 2 (electrical) accounts for 97%. CO2 emissions in FY2024 were almost the same as in FY2023, but the intensity decreased because the manufacturing volume increased significantly. For Scope 3, we calculated for all categories in FY2024.
We began purchasing renewable energy at the Amagasaki Headquarters in FY2023. As a result, approximately 35% of our domestic business sites were covered in FY2024. We will continue to purchase in FY2025. Starting in FY2022, we have been purchasing the “Niigata Prefecture Pack” as a carbon offset, which includes a set of various projects such as forest improvement initiatives throughout Niigata Prefecture. In 2024, we purchased 35 tons and retired the credit. We will continue this effort moving forward.
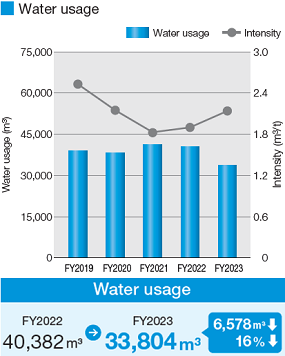
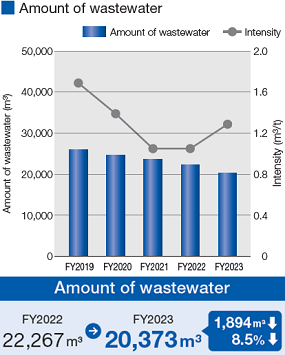
Water usage and amount of wastewater
Because water is a key ingredient in MEC’s products, the amount of water used changes according to changes in the volume of products manufactured. We understand the amount of water used and are aware that we use a large amount not only in our raw materials but also in our manufacturing facilities, container cleaning, and substrate processing lines in our R&D activities. For this reason, we are working to reduce the number of times equipment is cleaned, to introduce automatic container-cleaning equipment, and to reduce wasteful use in substrate processing line work. Water used in manufacturing and R&D operations is treated in wastewater treatment facilities in line with the regulated standards and discharged into the sewerage system as wastewater. We manage wastewater to ensure that we do not discharge wastewater that exceeds standards. In FY2024, there were no wastewater discharges that exceeded standards. We will continue to make efforts for appropriate management.
Reuse of plastic containers
In order to make effective use of limited resources without waste, we collect used polyethylene containers of our products from our customers. We sort the containers to determine if they can be reused, and those that can be reused are cleaned and reused by the Company and contractors.
Proper disposal of wastes
The amount of industrial waste discharge in FY2024 was 402 tons, almost unchanged from FY2023. The amount of specially controlled industrial waste was 152 tons, a decrease of 29 tons from FY2023 (down 16%). The final amount of disposed industrial waste was 51 tons. We will continue our efforts to limit the amount of industrial waste generated, and endeavor to reduce the final disposal volume by thoroughly sorting industrial waste generated.
Environmental Accounting for FY2024
(Information on sites in Japan)
Table Environmental conservation cost in FY2024
Development standards
- Data gathering period: 12 months from January to December 2024.
- Scope: MEC CO., LTD. [Amagasaki Headquarters (Head Office / R&D Center / Amagasaki Factory), Higashi-hatsushima Headquarters (Head Office / R&D Center), Nagaoka Factory, Tokyo Sales Office.]
- "Environmental conservation cost" only targets cost whose objectives are clearly related to environmental conservation activities.
- "For the research and development cost", costs which can be categorized into themes are individually processed, while costs which cannot be directly categorized are distributed in proportion based on theme-specific work hours.
- "The amount of the cost" includes depreciation costs and maintenance and management costs of facilities, as well as labor costs which are used for the purpose of environmental conservation.
Click here for various numerical data.
ESG Date